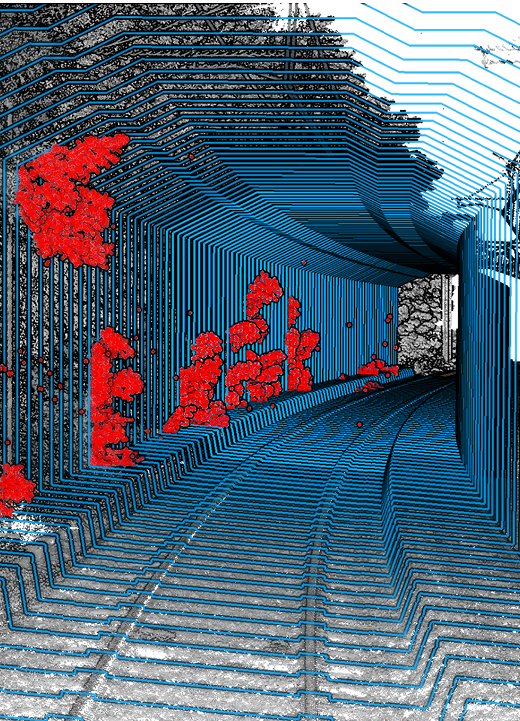
Analyze railway clearance profiles
Using Lidar data, we deploy our artificial intelligence algorithms to automate the analysis of railway clearance profiles. We check that nothing exceeds the authorized limits by analyzing clearances and profiles. This includes detecting obstacles that encroach on N or extended N contours (depending on the lines), low-level obstacles, those related to catenary contact wires, and measuring track center distances to ensure full compliance.
Learn more
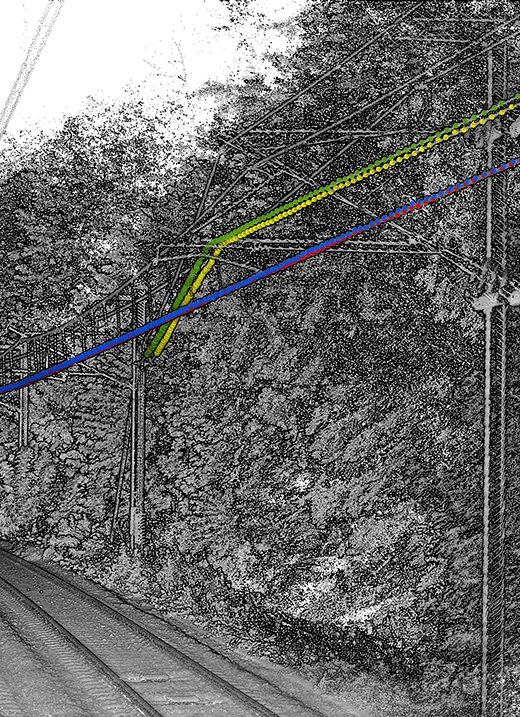
Measure Overhead Line Equipment
The traction current, supplied by substations distributed along the track, is carried by an overhead traction line to the locomotive, where it is captured by the pantograph’s collector rubbing against the contact wires.
Since continuous contact between the overhead traction line and the moving train must be maintained, it is crucial to precisely know the geometric position of the contact wires relative to the track, as well as the relative positions of the contact wires in complex areas.
Learn more
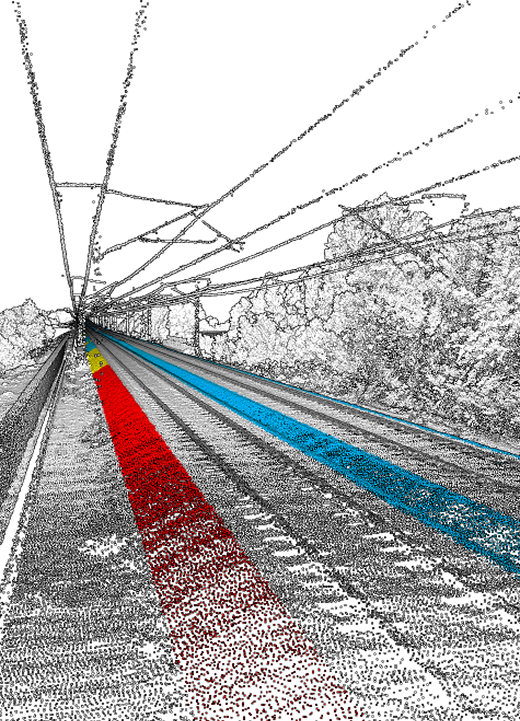
Verify the compliance of ballast profiles
Ballast maintenance and adjustment operations are crucial for the stability and longevity of the track, and they represent a significant portion of expenses for SNCR Réseau.
For instance, in 2019, expenditures in this area amounted to €67 million, with €61 million directly related to these operations.
En savoir plus
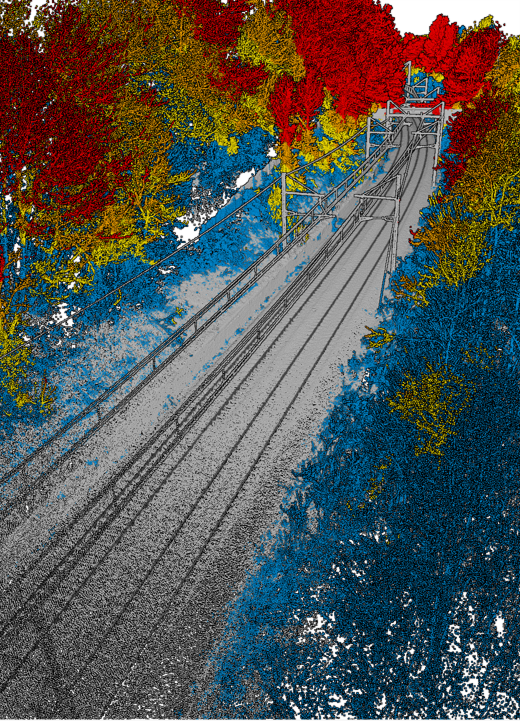
Characterize hazardous vegetation near the tracks
8,000 hours of train delays and an annual budget of 120 million euros: that's the burden that vegetation represents for SNCF Réseau.
En savoir plus
Put our technology to the test — let’s create a new use case together!
Are you managing industrial infrastructures? Do you have large linear assets to analyze?
Let us take on your project!
The data we work with is incredibly rich, and it’s up to us to unlock new ways of using it. Whatever your industry, our technologies adapt to your needs.
2D visualisation
Grâce à l’outil de visualisation 2D des données géographiques, vous disposez de nombreux outils permettant d’annoter, mesurer, historiser ou comparer sa donnée et générer ainsi un premier niveau de connaissances sur vos infrastructures.
3D visualisation
You can directly deposit your data to map an infrastructure and/or obtain a 3D scale model.
Numerous measurement, classification, cutting and navigation functions in a 3D space are available.
Photogrammetry
To create the digital twin of your facilities, Altametris Suite offers photogrammetry tools that allow you to carry out simple and intuitive processing directly in the Cloud and to generate:

Création of panoramas
Altametris Suite includes the automatic creation of 360° panoramas. You can carry out virtual tours of your sites and installations or monitor your worksites.
Simply upload your raw data and Altametris Suite will produce your panoramic views in almost real time.

A unique tool that lets the user centralise and visualise all infrastructure for a better correlation of data.

A simple and intuitive tool: direct access via the web and management of teams and users.

2D, 3D and 4D data visualisation and comparison tools for better intra- and inter-project analysis.
Cutting-edge technologies: AI to automate data processing and the production of relevant knowledge.
Why go digital to optimize the maintenance of your infrastructures?
Reduce costs and optimize maintenance work, anticipate future projects, access precise and objective information, and gain a clear understanding of your infrastructure’s layout — from the number and types of defects to the surrounding environment.
These are just some of the many benefits of using a digital twin.
In this white paper, we share 5 key insights to help you fully harness the power of digital technology for maintenance optimization.
.png?width=458&height=305&name=Magazines%20Mockup%2c%20Top%20View%20(2).png)
Download the white paper


 Contact us!
